

Reach is roughly how many different people saw something. Impressions is roughly how many times it was shown, counting the same person more than once. Views is what video-led platforms count, and each decides for itself how long counts as a view. Engagement is people doing something in response: liking, commenting, sharing, saving. The word "roughly" is doing real work in every sentence, because each platform defines each term its own way, and the differences are large enough that comparing them across platforms produces nonsense.
This article gives plain definitions, explains where the platforms diverge, and sets out which comparisons are fair and which are not.
The four words, defined
Reach
The number of distinct accounts that saw a post, or your content over a period, at least once. It answers "how many people". A post shown to the same person five times has a reach of one on that person. Reach is usually smaller than impressions and cannot be larger.
Impressions
The number of times a post was displayed, whether or not it was the same person seeing it again. It answers "how many showings". Dividing impressions by reach gives an average number of times each person saw the post, which is occasionally interesting and usually not.
Views
Video-led platforms count views rather than impressions, and this is where definitions diverge most. Some count a view the moment a video appears on screen. Some count it after a fixed number of seconds. Some count replays; some do not. Some platforms have moved to calling every content display a "view", including for images and text, which makes their views closer to impressions. A view on one platform is not a view on another.
Engagement
Any action a person takes on a post beyond seeing it: likes and reactions, comments, shares and reposts, saves, clicks, sometimes follows attributed to the post. Platforms bundle these differently, and some report a total "engagement" figure while others report the components and leave the adding to you. Engagement rate, where a platform offers it, is engagement divided by something, and the something is not the same everywhere: sometimes reach, sometimes impressions, sometimes followers.
Why the platforms disagree
Partly history: each platform grew up measuring what its own format made easy to measure. Partly incentive: each has reasons to present its numbers the way it does. And partly honesty about limits: a platform can only report what it can actually observe on its own surfaces.
The practical consequences for anyone reading a dashboard:
- The same post can have a large view count on one platform and a modest impression count on another and be performing identically in human terms.
- Some platforms do not expose reach to tools at all, or only for certain account types. A blank is not a zero.
- Definitions change. A platform that alters what counts as a view will move every number on your chart without your content changing.
- Engagement totals bundle different actions. A total that includes saves on one platform and does not on another is two different measurements wearing one label.
Which comparisons are fair
Fair: the same account, the same figure, over time
Impressions on your account this month against impressions on the same account last month. Engagement on this platform this quarter against last. Directions, on one platform, in that platform's own terms. This is what analytics is for, and it needs a history; how to build a history of social media performance covers that.
Fair: which posts did better than others on one platform
Within a single account, the platform's figures for one post can be set beside its figures for another. The team photo against the price list. Both were measured the same way.
Not fair: adding figures across platforms
Views plus impressions plus reach is a number with no unit. Dashboards do this because the figures are all in one place and a big number is pleasant to look at. Ignore it.
Not fair: comparing an "engagement rate" across platforms
Unless you know each platform divided by the same thing, and they generally did not.
Not fair: treating a blank as a zero
A platform that did not report reach has not reported zero reach. A tool that writes 0 in the blank has invented a measurement.
How WyreIt shows these figures
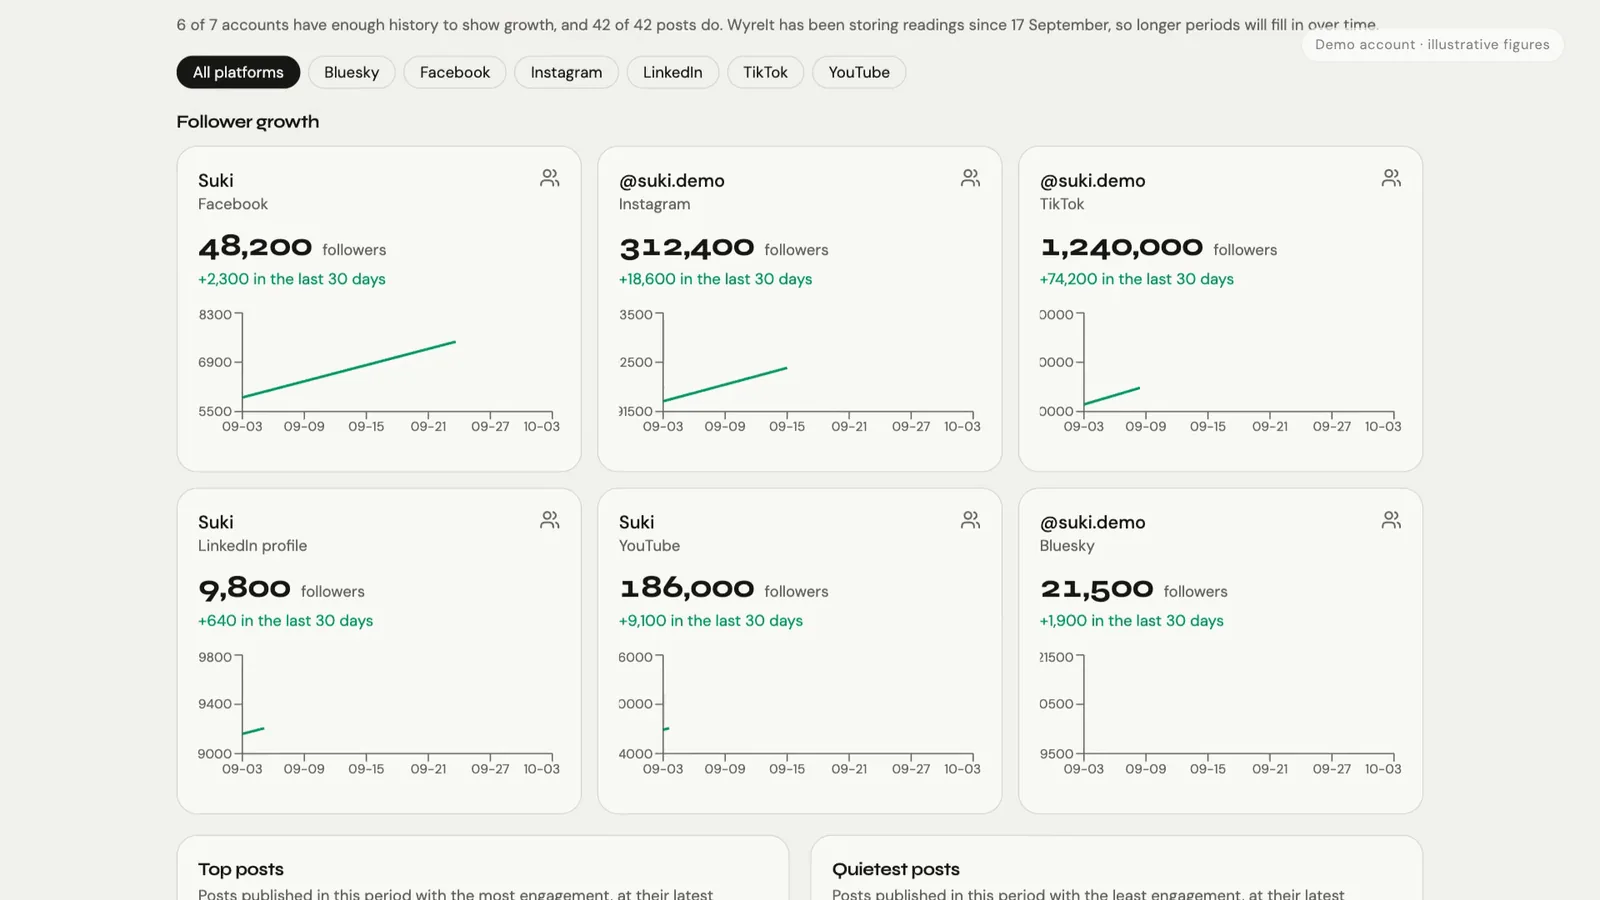
WyreIt records what each platform provides for each account, in that platform's own terms, and shows what it has rather than forcing every platform into the same grid.
- Per platform, per account. A platform's figures stay in its own column. Two accounts on one platform are two rows. Nothing is added across platforms into a total.
- Measured zero is 0. A platform that returned nought is shown as nought, because that is a measurement.
- Unavailable is unavailable. A figure WyreIt could not read this time is marked so, with the reason where there is one.
- Unsupported is unsupported. A figure a platform does not offer is marked as such, so you are not invited to fix something that cannot be fixed. Different platforms expose different metrics, and WyreIt shows what each one provides.
- Compared with the previous period. 7, 30 and 90 day views, each against the period before, so the fair comparison is on the screen.
- Freshness on every figure. Each number says when it was taken.
All of it is built on confirmed publication: a post is counted only when the platform handed back its own record, and a failed destination is shown as failed rather than as a post with zero engagement. What happens when one platform publishes and another fails and the WyreIt Analytics page explain that rule.
A short glossary for the rest of the dashboard
- Followers, subscribers, connections, fans: four platforms' words for the accounts that have chosen to see your content. Compare each with its own past only.
- Clicks: taps on a link or on the post itself. Some platforms report them; many do not report them to tools.
- Saves: a person bookmarking the post. A strong signal where a platform offers it; absent where it does not.
- Watch time: total seconds of video watched. Video platforms only, and defined differently on each.
- Deliveries: WyreIt's word for a confirmed publication to one account. One post to three accounts is three deliveries.
Common questions
Is reach or impressions more important?
Neither is more important in general. Reach tells you how many people; impressions tells you how often. For a local business, reach on a local audience is usually the one to watch. For a post meant to be seen repeatedly, impressions. Compare each with its own past rather than choosing between them.
Why is my view count so different on two platforms for the same video?
Because they count a view differently: after a different number of seconds, with or without replays, with or without autoplay. It is not evidence that one platform's audience liked it more.
Can I calculate my own engagement rate across platforms?
You can, but decide what to divide by, use the same denominator everywhere, and remember that the engagement totals themselves bundle different actions on each platform. A rate you calculated consistently is more honest than the platforms' own, but still only fair within one platform over time. How to track performance across multiple platforms goes through a method.
Which of these figures should a small business watch?
Whichever one the platform reliably gives you, compared with its own past, plus whether the post actually published. Social media analytics for small business narrows it down to three questions.
If WyreIt says it published, it has evidence it published. Four words, defined; one rule: compare a figure with itself over time, never across platforms. Analytics is included on every plan and in the 14-day free trial, with no card needed. See how WyreIt Analytics works or see pricing.
WyreIt is a social media management tool for small business owners and sole traders. Post to Facebook, Instagram, X, TikTok, and more from one dashboard — at a fraction of the price of Hootsuite.