

To track social media performance across multiple platforms, start from what actually published on each one, keep each platform's figures in that platform's own terms, compare each account with its own past rather than with the others, and record the readings over time so a comparison is possible at all. Do those four things and the rest is looking at the result. Skip any of them and you get a dashboard full of numbers that cannot be trusted or compared.
The problem: platforms do not measure the same thing
Every platform exposes a different set of figures, defines them differently, and changes them without telling you. One counts a view after a fraction of a second; another after several. One reports reach; another reports impressions; another reports neither and gives you views. Followers, subscribers, connections and fans are four words for four slightly different things. Reach vs impressions vs views vs engagement untangles the vocabulary.
The consequence is that most cross-platform "totals" are meaningless. Adding a video platform's views to a text platform's impressions produces a number with no unit. That does not stop dashboards doing it.
Step one: start from confirmed publication
Before you measure how a post performed, you need to know whether it existed. A post that failed on one platform has no performance there, and a tool that counts the attempt will give it a zero that looks like an audience shrug. Make sure the figures you are looking at are built only from destinations the platform confirmed. Why failed social posts should not appear as published explains how to check.
Step two: keep each platform in its own terms
Do not convert. Do not add across. Track each platform's figures as that platform defines them, side by side.
- Per platform: how many posts published there this period, and the engagement figures that platform provides for them.
- Per account: if you have two accounts on one platform, two rows. A second shop and the main shop are two audiences.
- Marked where unavailable: a figure the platform did not give you is a blank with a reason, not a zero.
The comparison you want is not "which platform is best" measured in one unit. It is "is each platform doing better or worse than it was", measured in its own.
Step three: compare each account with its own past
The only fair comparison for an account is the same account, earlier. This month against last month. This 30 days against the 30 before. That needs a history, and a history needs readings taken over time, because the platforms show you today and overwrite yesterday. How to build a history of social media performance is the long version; the short one is that if nothing is recording, you will have nothing to compare in three months.
Watch the previous period, not the total
A total is a fact about the past. A change against the previous period is a fact you can act on. "Twelve posts published across three platforms, up from nine" tells you something; "twelve posts" alone does not.
Trust a trend only when there is one
Two readings make a line. One does not. A tool that draws a rising trend from a single point is decorating, not measuring. Be suspicious of any chart that has no gaps, either: a day the platform could not be read should be a gap, not an invented point.
Step four: read the freshness
Every figure was taken at some moment. A number from an hour ago and a number from a week ago are not the same kind of fact, and a dashboard that presents them identically is hiding something. Look for the timestamp; if there is none, assume the number is older than it looks.
How WyreIt does it
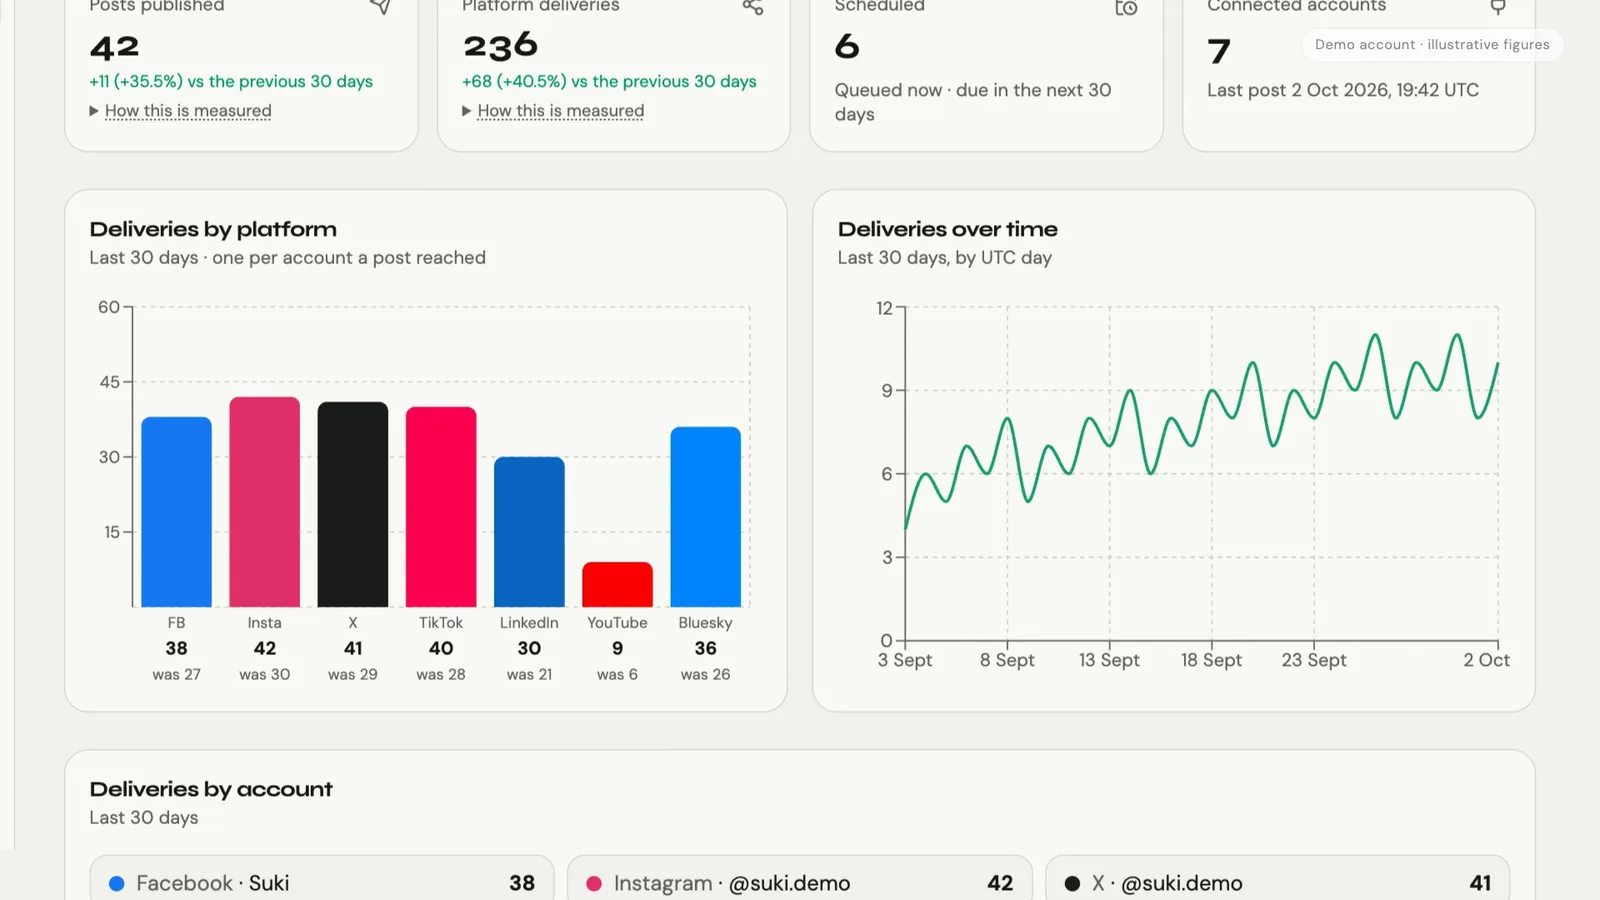
WyreIt's publishing overview counts published posts and platform deliveries over 7, 30 or 90 days, compares each with the period before, and breaks deliveries down by platform and by account. It is built only from destinations the platforms confirmed; a failed destination is shown as failed and an unconfirmed one as unconfirmed, and neither is counted as published.
Underneath, WyreIt records readings over time, in the background, so that post performance and account figures become a history rather than a snapshot. A measured zero is shown as 0; a figure that could not be read is unavailable with the reason; a figure a platform does not offer is marked as unsupported; and where there are not yet two readings, WyreIt shows the level it has and says it cannot show a change yet. Every figure says when it was taken. The full account is on the WyreIt Analytics page.
WyreIt does not produce a cross-platform engagement total. Two accounts on the same platform are two histories. For agencies, the same rule applies between clients: each client's figures stay in the client's own workspace and are never summed into a portfolio number; see how WyreIt works for agencies.
A weekly routine that takes ten minutes
- Check publication first. Anything failed or unconfirmed this week? Fix connections before reading any other number.
- Read the 7-day overview against the previous 7. Posts published, deliveries, by platform. Up, down or flat, and why.
- Open the one or two platforms that moved. Look at the posts behind the change, in that platform's own figures.
- Glance at account-level trends where they exist. Followers or equivalents, where the platform supports it. Do not read anything into a single point.
- Note one thing to do differently next week. A routine that produces no decision is a habit, not analysis.
Common questions
Can I compare engagement across platforms at all?
You can compare each platform's engagement with its own previous period, side by side. You cannot meaningfully add them together, because the platforms define the underlying figures differently. Comparing directions is fair; comparing totals is not.
Why does one platform show followers and another show nothing?
Because not every platform lets a tool read every figure, and some need a permission you have not granted. A good tool marks the difference between "not measured yet", "could not read it" and "this platform does not offer it". WyreIt keeps those three apart.
How far back does the history go?
From the day the account was connected and recording began. A tool cannot backfill years of history the platform never gave it, and a tool that appears to has usually drawn a line through the present figure. What happens when one platform publishes and another fails covers the other half of trustworthy figures: getting the publication right first.
Is any of this real-time?
No, and it does not need to be. Readings are taken on a schedule and each one says when it was taken. If you want to watch a number move by the minute, the platform's own app is the place; analytics is for deciding what to do next week.
If WyreIt says it published, it has evidence it published. Per platform, per account, against its own past, with the date on every figure. Analytics is included on every plan and in the 14-day free trial, with no card needed. See how WyreIt Analytics works or see pricing.
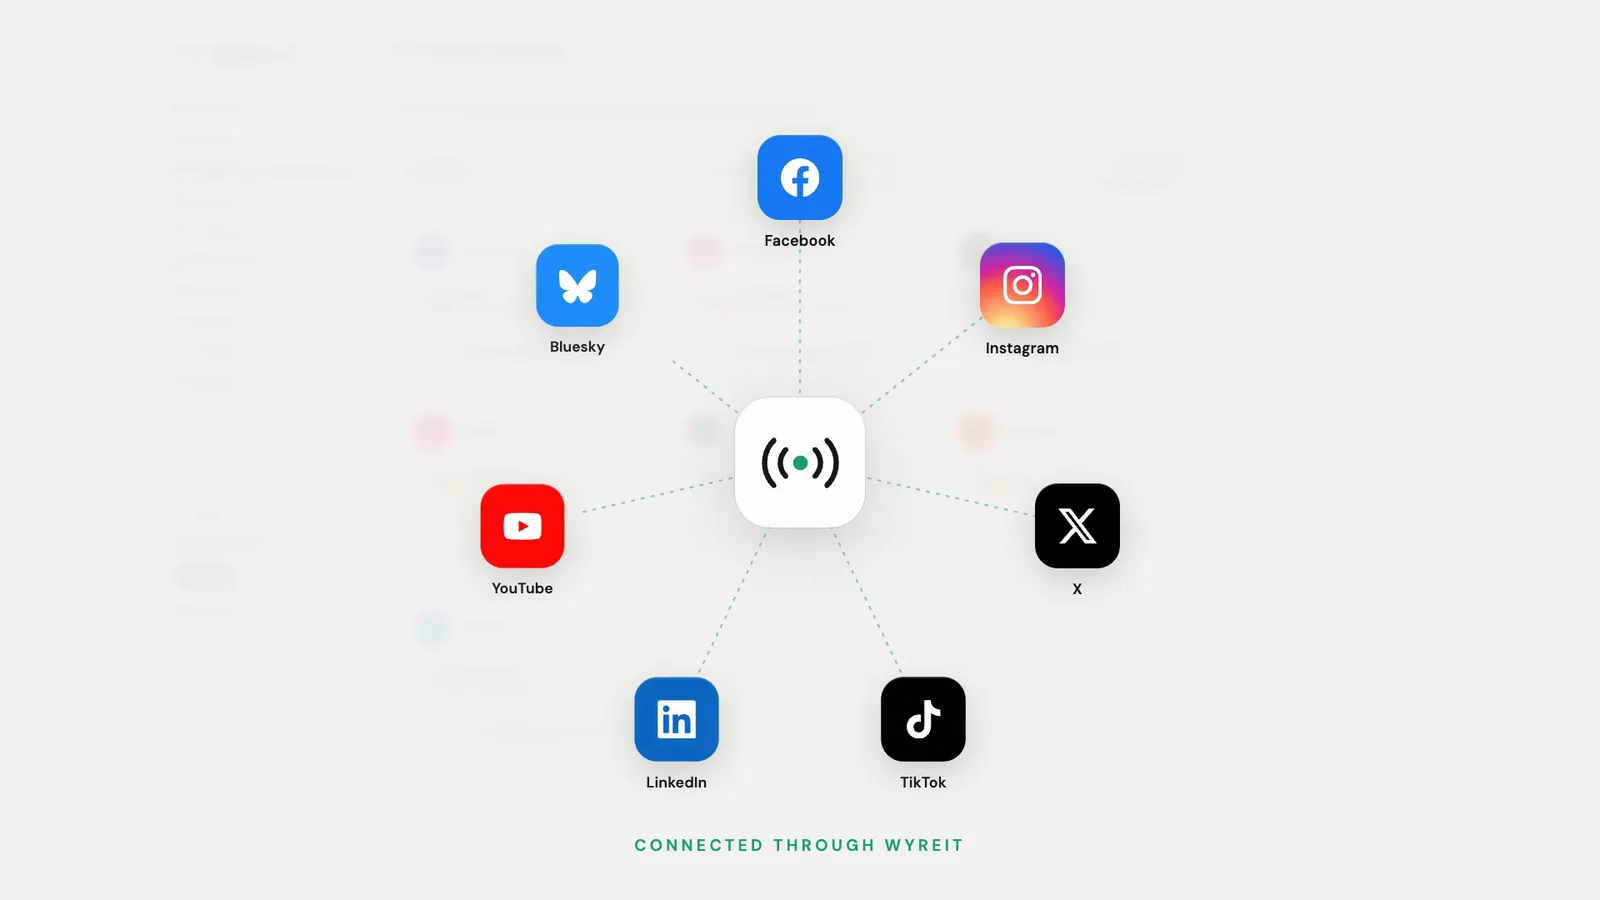
WyreIt is a social media management tool for small business owners and sole traders. Post to Facebook, Instagram, X, TikTok, and more from one dashboard — at a fraction of the price of Hootsuite.